

Contents
- What is marketing analytics and why it matters
- Core concepts you need to know first
- A 5-step measurement implementation roadmap
- Popular marketing analytics tools
- A practical example in the Vietnamese market
- Common mistakes when doing analytics
- How to get started this week
- Frequently asked questions
- Do small businesses need marketing analytics?
- Do you need to know programming to do analytics?
- How long does it take for marketing analytics to show value?
- Which metric should you start learning first?
- What is marketing analytics and why do businesses need it?
- Which metrics should be tracked in marketing analytics?
- What tools help beginners analyze marketing?
- References
Every month, your business pours money into advertising, content, email, and social media. But if you ask, “Which channel actually brings in customers?” or “How much does one dollar spent return?”, most marketing teams can only answer based on intuition. That is exactly why marketing analytics exists: to turn marketing activity from guesswork into data-driven decisions.
Marketing analytics is the process of collecting, measuring, and analyzing data from all marketing activities to understand what works, what wastes money, and where budgets should be allocated. This is not a privilege reserved for large corporations. An online store, a small agency, or a personal brand can all start with free tools and a few core metrics. This article is an overview that takes you from foundational concepts to practical implementation in the Vietnamese market.
What is marketing analytics and why it matters
Simply put, marketing analytics answers three questions: What happened? (descriptive), Why did it happen? (diagnostic), and What will happen next? (predictive). At the most basic level, you look at the numbers to see how much traffic and how many orders a campaign generated. At a more advanced level, you use data to forecast revenue and optimize budgets before spending money.

The importance lies in the fact that marketing analytics helps you stop guessing. Instead of debating “Is Facebook or TikTok better?”, you have concrete numbers on customer acquisition cost and the value each customer brings from each channel. It is also the common language between marketing and leadership: when you present revenue and profit instead of likes, marketing budget is seen as an investment rather than a cost.
Core concepts you need to know first
Before touching any tools, you need to align on terminology. Analyzing data without clearly understanding what each metric means leads to misinterpretation and bad decisions. Below are the core concepts everyone in marketing should know.
- Metric is a measurable number, such as sessions, orders, or revenue.
- Dimension is an attribute used to break metrics down, such as by channel, device, or geographic region.
- KPI is a key metric that reflects a business goal. Not every metric is a KPI; you should read What is KPI carefully to distinguish vanity metrics from metrics that truly drive decisions.
- Conversion is the action you want users to take: purchase, fill out a form, or subscribe to a newsletter.
Within this group, the most important metric for any online business model is conversion rate. If your landing page has 1,000 views and 20 orders, the conversion rate is 2%. Improving this number is often much cheaper than spending more money on traffic. If you are not yet clear on how to calculate it and what a reasonable benchmark is by industry, see what conversion rate is before setting website goals.
There are also cost and value metrics: CPC (cost per click), CPA (cost per acquisition), CAC (customer acquisition cost), LTV (lifetime value), and ROAS (return on ad spend). When you place CAC next to LTV, you can tell whether the model is sustainable: if acquiring one customer costs 200,000 VND but that customer only brings in 150,000 VND, you are losing money even if the ad report looks great.
A 5-step measurement implementation roadmap
Marketing analytics is not about installing a tool and staring at a dashboard. It is a process with a sequence. Skipping the first step and jumping straight into the numbers is the most common mistake that leaves teams drowning in data without extracting any action.

- Define business goals. Do you want to increase revenue, reduce customer acquisition cost, or improve retention? The goal determines what you measure.
- Choose the right KPIs. Each goal should have one, at most two, KPIs. If the goal is to increase orders, the KPIs are conversions and conversion rate, not follower count.
- Set up data collection. Install tracking tools on the website, define conversion events, and add UTM parameters to each campaign so you know where traffic comes from.
- Analyze and interpret. Compare over time, by channel, and by segment. Look for anomalies and ask why.
- Act and repeat. Shift budget to effective channels, cut wasteful ones, test landing pages with A/B testing, then measure again.
The faster this loop runs, the faster you learn. A strong marketing team is not the one with the prettiest dashboard, but the one that makes data-driven decisions most consistently and is willing to correct course when the numbers show the old direction is not working.
Popular marketing analytics tools
The good news is that you can start entirely with free tools. The current standard website measurement platform is Google Analytics 4. This is an event-based version that tracks user behavior across devices and integrates tightly with the Google ecosystem. If you are moving from Universal Analytics or setting it up for the first time, read what GA4 is carefully to understand the new data model before configuring it, because the way GA4 counts sessions and conversions is very different from previous generations.
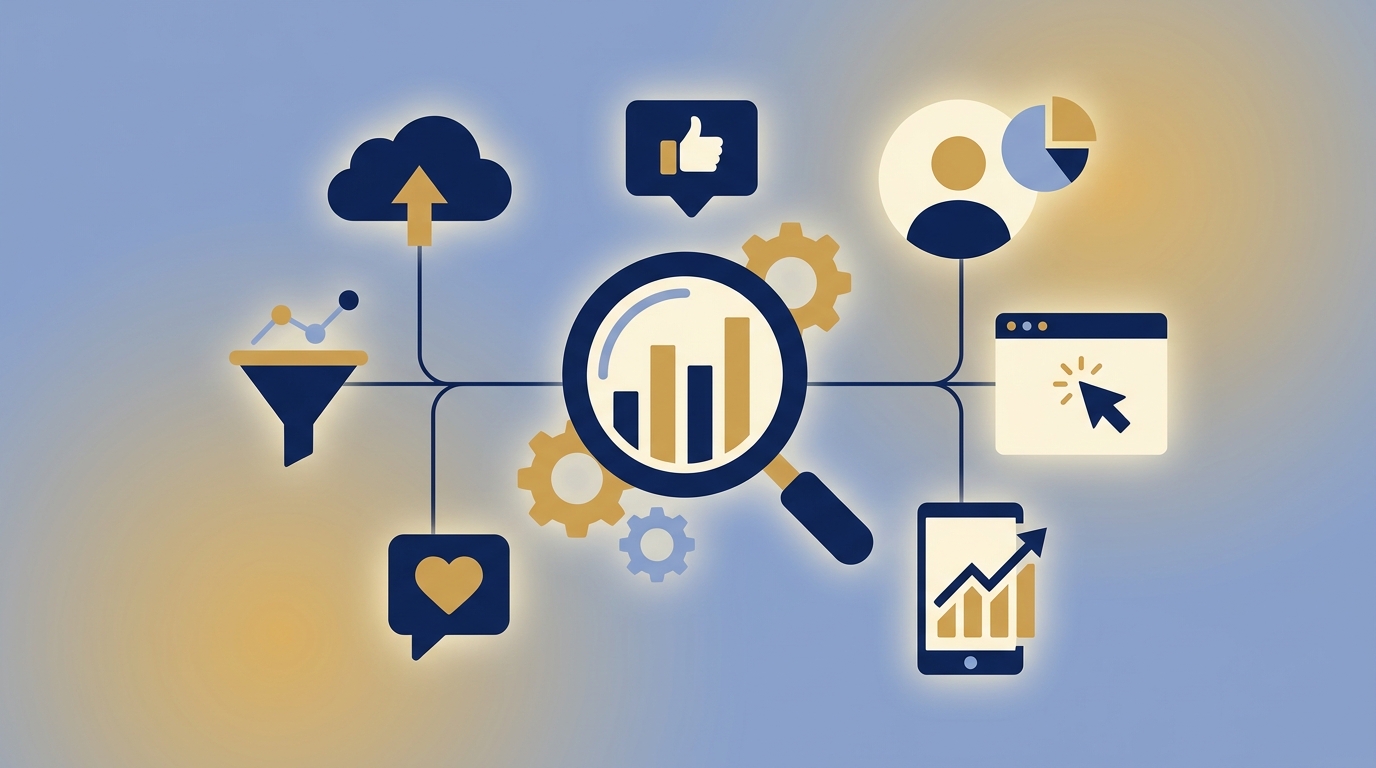
Around GA4, there is a common set of supporting tools:
- Google Tag Manager to manage tracking tags without touching code every time you add an event.
- Google Search Console to monitor organic search performance: keywords, rankings, and click-through rate.
- Looker Studio to build visual reports and combine data from multiple sources into a shareable dashboard.
- Ad platforms such as Google Ads, Meta Ads Manager, and TikTok Ads provide cost and conversion data at the campaign level.
- Behavior analytics tools such as heatmaps and session recordings help explain why users leave a page.
Practical advice: do not install everything at once. Start with GA4 and Search Console, master those two tools, then expand. A massive tool stack that nobody reads is worse than a simple dashboard reviewed every week.
A practical example in the Vietnamese market
Imagine a fashion store selling through a website and Facebook. Before applying marketing analytics, the owner only knew the monthly revenue total and had the feeling that “Facebook is performing well.” After adding UTM parameters to each ad post and defining purchase events in GA4, the picture changed completely.
The data showed that Facebook ads brought in a lot of traffic but had a conversion rate of only 0.8%, while traffic from Google Search was lower in volume but converted at 3.5%. That means Facebook’s CPA was twice as high as SEO content costs. The action taken: keep Facebook for awareness, while investing more heavily in search-optimized content to capture high-intent buyers.
Another example is a B2B service business. Their KPI is not immediate orders but the number of customers filling out a consultation form (leads). By tracking conversions on each landing page and analyzing the funnel, they discovered that 70% of users dropped off at the phone number field. After reducing the form from 6 fields to 3 and running an A/B test, the form completion rate nearly doubled without spending an extra đồng on advertising. This is the real power of marketing analytics: finding leaks and sealing them.
The common thread in both cases: data does not speak for itself. It only becomes valuable when you ask the right questions and turn the findings into a specific operational change.
Common mistakes when doing analytics
Most failures in marketing analytics do not come from a lack of tools but from the wrong approach. Below are the most common traps even experienced teams fall into.

- Chasing vanity metrics. Likes, followers, and page views sound impressive but do not directly generate revenue. Always tie metrics back to business goals.
- Setting up tracking incorrectly from the start. Misconfigured conversion events, duplicate counting, or forgetting to add UTM parameters makes all later analysis meaningless. Bad input data is even more dangerous than no data.
- Analyzing without a hypothesis. Opening a dashboard and aimlessly scanning numbers leads to paralysis from information overload. Start with a specific question.
- Making decisions on too small a sample. Concluding that one A/B variant won after 50 visits is self-deception. You need enough data for statistical significance.
- Ignoring context. A 20% revenue drop may be due to seasonality or a competitor promotion, not necessarily a bad campaign.
Avoid these mistakes and you are already ahead of most of the market. Marketing analytics rewards discipline and consistency more than complexity.
How to get started this week
If you are starting from zero, do not try to do everything. A realistic 30-day roadmap will build a much stronger foundation than taking on too much and giving up.

- Week 1: Install GA4 and Google Search Console on the website. Verify that data is flowing correctly.
- Week 2: Define the most important conversion events, such as purchases or form submissions. Add UTM parameters to every active campaign.
- Week 3: Choose three core KPIs and build a simple Looker Studio report to track them weekly.
- Week 4: Hold a team meeting to review the numbers, ask one specific question, and decide on one change to test.
After four weeks, you are no longer running marketing in the dark. From there, improve one level each month: deeper funnel analysis, adding LTV to reports, or testing a multi-channel attribution model. Analytical capability is something you build over time, not something you buy in one shot.
Frequently asked questions
Do small businesses need marketing analytics?
Very much so, even more than large businesses, because limited budgets mean every dollar spent has to be effective. The good news is that basic tools like GA4 and Search Console are free, enough for a small shop to know which channels generate orders and which ones waste money.

Do you need to know programming to do analytics?
No, it is not required. Most basic and intermediate work can be done through the drag-and-drop interfaces of GA4, Google Tag Manager, and Looker Studio. More important is analytical thinking: knowing how to ask the right questions and interpret numbers in a business context.
How long does it take for marketing analytics to show value?
You can get useful insights after just two to four weeks of data collection, enough to identify which channels convert well or which pages are leaking customers. However, real value comes from maintaining the measurement-and-action loop consistently over many months.
Which metric should you start learning first?
Start with conversion rate and the KPI tied to your business goal, because these two concepts directly connect data to revenue. Once you are comfortable, expand into cost and value metrics such as CPA, CAC, and LTV to assess the sustainability of each channel.
What is marketing analytics and why do businesses need it?
Marketing analytics is the process of collecting, measuring, and analyzing marketing data to understand which activities are effective and make decisions based on numbers. It is necessary because it helps you know where ad money goes, which channels bring in customers, and what should be optimized instead of relying on intuition.
Which metrics should be tracked in marketing analytics?
Depending on the goal, important metrics often include traffic sources, conversion rate, cost per customer, ROAS, average order value, and engagement. Each metric should be tied to a specific decision so you do not collect data without using it to improve performance.
What tools help beginners analyze marketing?
Google’s free tools such as Google Analytics 4, Google Search Console, and Google Looker Studio are enough to track and visualize data for most SMEs. As needs grow, you can add more advanced tools, but the key foundation is setting up tracking correctly from the start.