
Contents
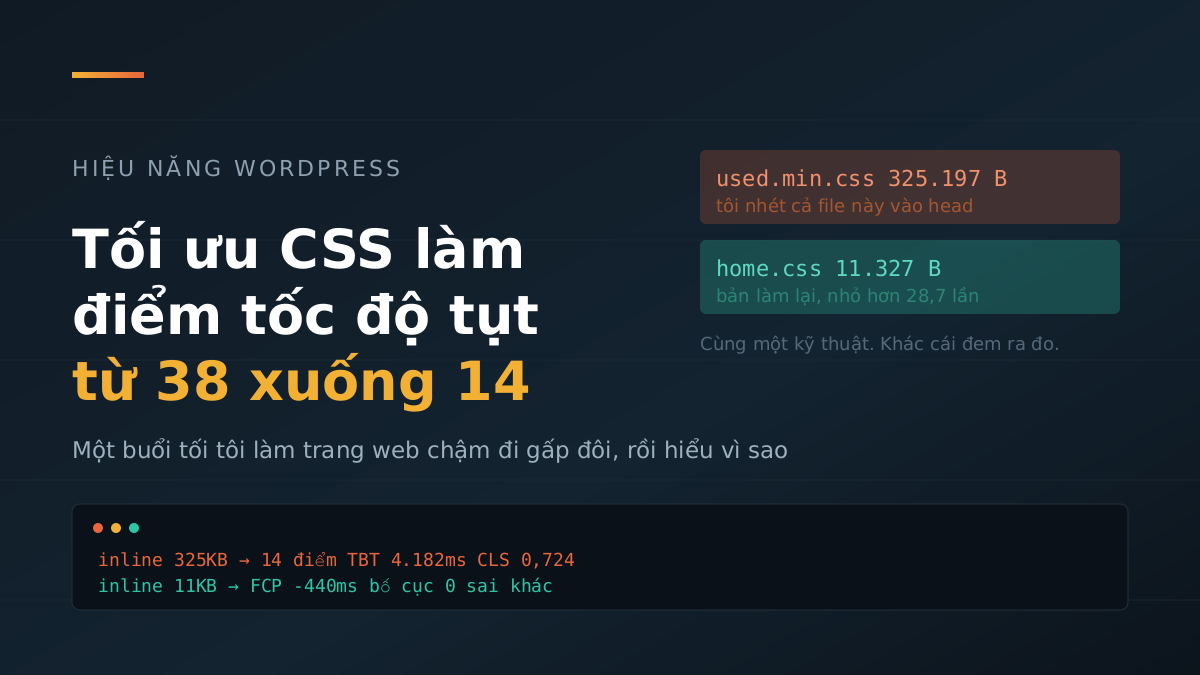
On the evening of 19/07/2026, I did something every speed-optimization guide recommends: I gathered the critical CSS and inlined it directly into the <head> tag, so the browser would not have to wait for a CSS file before painting anything on screen. The technique has a name, a tool, and hundreds of articles behind it. I finished, ran the test again, and the mobile speed score dropped from 38 to 14.
This article recounts where I went wrong, with two-way measurements: when it broke and when I redid it correctly. Every number in this piece comes from the measurement log of marketing365.vn itself, and most of it can still be checked today because the broken experiment file is still sitting on the server.
The number that made me think I had misread it
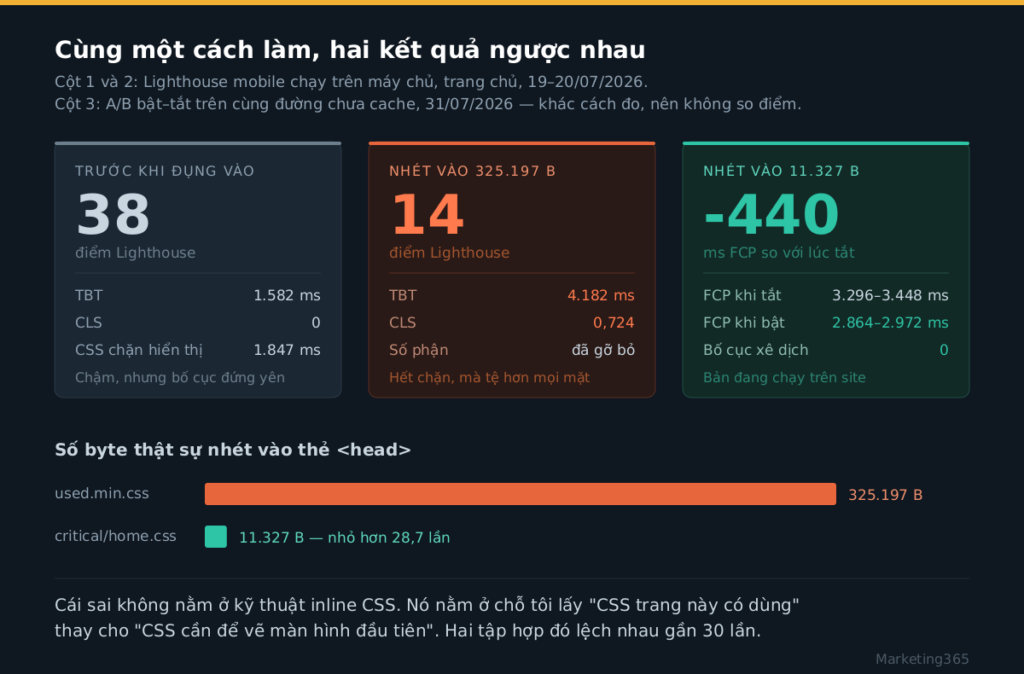
Before I touched anything, the homepage scored 38 on mobile. Slow, but consistently slow: CLS was 0, meaning the layout did not jump around after the page loaded. The culprit was obvious — the browser spent 1.847 milliseconds waiting for the CSS file before it dared to paint.
After I inlined the CSS directly into the page, that exact 1.847 milliseconds really did disappear. No CSS file was blocking the render path anymore. But three other numbers moved in the opposite direction:
- Total score: 38 down to 14
- TBT, the total time the browser was so busy it would not respond when you touched the screen: 1.582 up to 4.182 milliseconds — 2.6 times higher
- CLS, the amount of layout shift: 0 up to 0.724 — from perfectly still to wildly jumping
I removed one bottleneck and created three bigger ones. The “good” CLS threshold is below 0.1; 0.724 means the content jumped by nearly three-quarters of the viewport height while loading.
Why I thought I was doing the right thing
The site theme is Soledad, and its main CSS file weighs 1,208,930 bytes. Even after gzip compression, it is still 166,183 bytes. This is a very large file, and it blocks rendering — if it does not finish loading, the browser will not show anything. I wrote separately about trimming this exact file in cutting 80% of the theme CSS without moving LCP, and that result was not what I expected either.
The method I chose to reduce it sounded very reasonable: open the page in Chromium in automated mode, turn on CSS coverage measurement, and ask the browser, “Which rules does this page actually use?” Chromium returned a set of rules. I merged that set into a used.min.css file and inlined it into <head>.
The logic was: if you keep only the CSS the page truly uses, then what you remove is waste, and removing waste can only make things faster. That logic was wrong in one place I could not see at the time.
The mistake: “used” does not mean “needed to paint”
Chromium’s coverage feature marks every CSS rule that matches any element present on the page. Any element — including elements at the bottom of the page, the footer, the hidden mobile menu, and popups nobody has clicked yet.
What I actually needed was much narrower: only the rules required to paint the first screen the user sees. Everything else should be loaded calmly in the background, without blocking the render path.
Those two sets are not even close. They differ by nearly 30 times, and I have the exact number later in the article.
When I inlined 325,197 bytes of CSS directly into the page, the browser had to read and build all of it before it could paint the first line. It no longer had to wait for the network, but it had to compute far more — that is the 4.182 milliseconds of TBT. And because that bundle included rules for blocks that did not even exist at load time, the page painted one state and then rearranged itself when the real content arrived — that is CLS 0.724.
The cost, measured in numbers
Read more: Cut 80% of Theme CSS Without Moving LCP
This is where I need to state a limitation of the measurement. This server runs many things at once, so running Lighthouse directly on it produces noisy millisecond readings — two back-to-back tests can differ by a few hundred milliseconds for no clear reason. The three numbers in columns 1 and 2 are still usable because the gap between them is too large to blame on noise: TBT was 2.6 times higher, and CLS went from 0 to 0.724. But when I redid the work properly, I abandoned that scoring method and switched to comparing on/off states along the same load path.
Two numbers tell the whole story, and they can still be checked right now on the server:
# broken experiment file, still left on disk
$ wc -c wp-content/mna-critical/used.min.css
325197

# CSS that is actually being inlined into the homepage today
$ wc -c wp-content/mna-css/critical/home.css
11327
$ gzip -c wp-content/mna-css/critical/home.css | wc -c
2912
325,197 versus 11,327. 28.7 times smaller. Same technique, same page, different answer to the question of what should be inlined.
Redoing it with a tool that measures the right thing
The second time, I dropped Chromium coverage and switched to penthouse — a tool that renders the page at a specific screen size and then extracts only the rules involved in painting the visible area. That is the exact definition of what I needed from the start.
Run for three page types, combining two screen sizes, 412×823 for mobile and 1440×900 for desktop, then compressed:
- Homepage: 11,327 bytes (gzip 2,912)
- Article page: 18,322 bytes (gzip 4,315)
- Category page: 18,702 bytes (gzip 4,306)
The theme’s large CSS file was not thrown away; it was simply moved to the queue: the page still loads it, but loads it in a way that does not block rendering. On the live homepage, that file is the trimmed version at 242,993 bytes, gzip 32,022.
This time I measured by turning the feature on and off, repeating three times per side, on the same uncached load path. With it off, first paint landed at 3,296–3,448 milliseconds and always came after the final CSS file arrived. With it on, the number was 2,864–2,972 milliseconds, and the page finished painting before the final CSS file by about 1.1 seconds.
The difference is about 440 milliseconds. But I trust the other signal more — whether the page finishes painting before or after the CSS arrives is a before-and-after relationship that does not depend on how busy the server was that day.
As for layout: I measured the coordinates and dimensions of 7–8 blocks across three page types and two screen sizes, comparing on versus off. The result was 0 difference. There was one case where CLS rose to 0.018 on an article page on mobile, but in 6 measurements with it on I saw it once, and in 4 measurements with it off I saw it once — it was already there before, not caused by the new CSS.
If you plan to do this, check three things
- Weigh the file before inlining it. If inlined CSS is over 20,000 bytes, you are almost certainly using the wrong set. My 325,197-byte file should have been an alarm bell the moment it was created, before any measurement.
- Watch CLS, not just “render-blocking CSS.” The render-blocking metric going to 0 made me think the job was done. It really did go to 0, while the two more important metrics were badly broken. I got caught by the same kind of mistake again when cache reported as enabled and I thought optimization was finished, only to find that the cache was on but the site was still 1.3 seconds slow because of a directory-permission error.
- Keep a rollback path. The version now running is set up as two files: one file contains the code, and one file flips the switch. Delete the switch file and everything goes back to normal in one second, with no other changes needed. That is why I was willing to turn it on and measure it on the real site.
What I learned is not “never inline CSS.” That technique is valid, and the corrected version is now running on this site. What I learned is that a measurement tool can answer a question that is very precise but slightly different from the one you actually need to ask — and if I do not read carefully what it is measuring, I will confidently break the very thing I meant to fix.
I still keep that 325,197-byte used.min.css file on the server. Not in use anymore, just as a reminder.