

Contents
- What to measure before cutting: browser coverage, not gut feeling
- On the wire, the savings are much smaller than the 80% headline
- The score went up 9, TBT fell 65%, but LCP did not
- The safety net reloaded enough to erase the savings
- How we kept a rollback path: one file, delete it and done
- If you plan to do this on your own site
The Soledad theme that marketing365.vn uses loads a single CSS file called main.min.css, weighing 1,208,930 bytes. That is the number measured on disk this morning, 14/08/2026. A CSS file of more than one megabyte for a news site — it blocks rendering, sits on the critical path, and PageSpeed reports more than 1.2 MB in it that has never been used.
On 20/07/2026 we cut it down to 242,993 bytes and pushed it live. This article records how we cut it, the before-and-after measurements, and the harder part to say: the most important metric — LCP — did not improve at all, and even edged slightly worse. Along with a mistake that swallowed all the gains within two days without us noticing.
What to measure before cutting: browser coverage, not gut feeling
The only way to know which CSS lines are actually used is to let the browser say so. Chromium has a coverage feature: open a page, and it records every CSS byte that gets applied to any element. We ran coverage across a representative URL list — homepage, category page, single post, search page, 404 page, mobile version, and desktop version — then merged the selectors that were still alive.
The most fragile part was not the scan, but rebuilding the file. CSS is not a flat list: a selector inside @media (max-width: 767px) means something very different when it is pulled out. If a trimming tool only keeps scattered lines and stitches them together, the mobile layout will break silently. So the rebuild script followed the PostCSS AST tree and preserved the outer @media structure.
The result of this step can be measured in three numbers, run on the server itself this morning:
$ ls -l main.min.css main.pruned.css
-rw------- 1 www-data www-data 1208930  main.min.css
-rw-r--r-- 1 www-data www-data  242993  main.pruned.css

$ grep -o "{" main.min.css    | wc -l   → 9983   rule blocks
$ grep -o "{" main.pruned.css | wc -l   → 2474   rule blocks

$ grep -o "@media" main.min.css    | wc -l → 260
$ grep -o "@media" main.pruned.css | wc -l →  39
7,509 rule blocks were removed, equivalent to 75.2% of the rules. The @media count dropped from 260 to 39 — proof that the script did not pull selectors out of context, but instead removed entire media blocks with no surviving selectors.
On the wire, the savings are much smaller than the 80% headline
This is the easiest place to fool yourself. Cutting 1,208,930 bytes down to 242,993 bytes sounds like saving 966 KB. But CSS travels over the network with gzip compression, and CSS compresses extremely well because it repeats so much. So we measured the exact thing real visitors actually download:
$ gzip -9 -c main.min.css    | wc -c → 164160
$ gzip -9 -c main.pruned.css | wc -c →  31664
Over the wire, the real saving was 132,496 bytes, or about 129 KB rather than 966 KB. Still −80.7%, almost the same ratio, but the absolute value is seven times smaller than the number seen on disk. For a visitor on 4G at around 5 MB/s, 129 KB is about 26 milliseconds. Anyone expecting CSS trimming to transform load speed should know this scale in advance.
All render-blocking CSS on the homepage today was 7 files, totaling 406,995 raw bytes and 66,657 bytes after compression. The trimmed file accounted for 242,779 raw bytes — still the largest file, but now it was in the same league as the rest instead of being four times larger than everything else combined.
The score went up 9, TBT fell 65%, but LCP did not
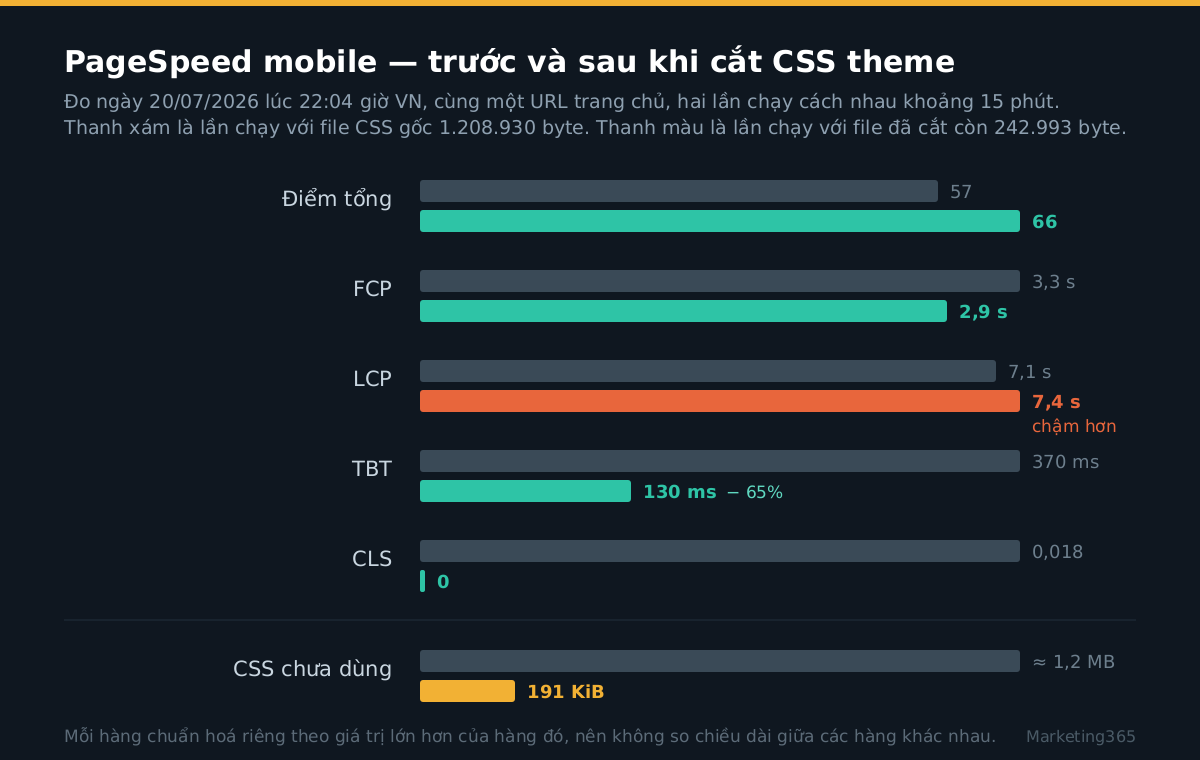
Two mobile PageSpeed runs on the evening of 20/07, about 15 minutes apart, on the same homepage URL:
- Overall score: 57 → 66
- TBT: 370 ms → 130 ms, down 65%
- CLS: 0.018 → 0
- FCP: 3.3 s → 2.9 s
- Unused CSS: about 1.2 MB → 191 KiB
- LCP: 7.1 s → 7.4 s
The first five lines are what everyone wants to show off. The last line is the one worth talking about. LCP is the metric Google uses to score loading experience, and it not only failed to drop, it ticked up by 0.3 seconds — within the noise range between two runs, so the honest reading is: cutting 80% of the CSS did not improve LCP for this page at all.
That makes sense when you look closely. The homepage LCP is determined by the largest image element and by how quickly the server returns the first byte, not by CSS file size. Heavy CSS blocks the main thread — and indeed, TBT fell 65%. It does not make the hero image load faster. Those are different things, and we had lumped them together before we had measurements.
Read more: CSS Optimization Sent Page Speed From 38 to 14
The safety net reloaded enough to erase the savings
When we pushed the trimmed file live, we left a safety net in place: the original 1.2 MB CSS file was still loaded asynchronously in the background, in case coverage had missed a selector and something on the site broke. It sounded reasonable. It ran that way for two days.
On 22/07, when we opened PageSpeed’s mainthread-work-breakdown panel to see why the score would not move further, we finally saw what was happening. Comparing the version with the safety net to the version with it disabled:
Style & Layout        + 703 ms   (caused by the safety net)
Other                 +1082 ms
Total Blocking Time   + 656 ms

Script Evaluation     - 529 ms
Script Parse/Compile  - 640 ms
The browser still had to download, parse, and recalculate all 1.2 MB of that CSS, just one beat later. Asynchronous loading does not make the file disappear — it only shifts the cost elsewhere on the main thread. The “savings” existed only on paper for two full days.
There is a secondary lesson hidden in that same table. A 656 ms increase in TBT makes the first instinct to blame JavaScript, because TBT is almost always discussed alongside JavaScript. But the last two lines show that JavaScript actually got lighter that day. The culprit was CSS. Since then, the team’s rule has been: if TBT gets worse, open the main-thread breakdown first — do not guess.
After turning off the safety net, we measured again at 15:11 on 22/07: 60 points, FCP 2.9 s, LCP 7.2 s, TBT 330 ms, CLS 0. The score was lower than the 20/07 evening run because PageSpeed fluctuates between runs — another reason never to draw conclusions from a single measurement.
How we kept a rollback path: one file, delete it and done
Replacing a theme’s CSS is the kind of change that, if wrong, can make the whole site look broken. So the infrastructure was built so that returning to the old state takes only a few seconds, with nothing to remember.
The CSS path switch lives entirely in a single mu-plugin. Want to disable it: delete that exact file, and the site immediately goes back to loading the original main.min.css. No theme edits, no functions.php changes, no removal steps to remember. The file name was also chosen deliberately so it loads before other mu-plugins, avoiding a case where another plugin has already registered the CSS handle.
There is also a layout-check script: it captures the height and position of key blocks across multiple URLs, then compares the before and after versions. One thing to know when using this kind of script — it is noisy. On our site the noise band is about ±12 pixels, coming from lazy-loaded images and late-loading fonts. An 8-pixel difference does not mean a break; a 60-pixel difference does.
If you plan to do this on your own site
Three things we would tell our 20/07 selves:
Do not reload the original file in any form. If you do not trust the trimmed file yet, keep it in staging and expand the coverage URL list. Asynchronous fallback loading is a way to erase the benefit with your own hands while still thinking you are being careful.
Decide in advance which metric you are buying. Trimming CSS buys TBT and the overall score. It does not buy LCP. If your problem is LCP, the time is in the server and in the images — that is where you need cache and image fixes, as in the case of cache enabled but the site still 1.3 seconds slow that we ran into three times in three weeks.
Measure with an external tool, not on the server itself. A VPS that is hosting the site is not the place to score performance: it has to serve requests and run the measuring browser at the same time, so the numbers are not usable. We took the numbers from Google’s PageSpeed Insights. The basic WordPress speed-check method is covered separately in how to check WordPress website load speed correctly.
The trimmed file is still serving on marketing365.vn as of today, 14/08/2026, nearly a month after it went live. There have been no reports of broken layouts. The real gains were a two-thirds drop in TBT and CLS down to 0 — smaller than the original expectation, but real numbers.