
Contents
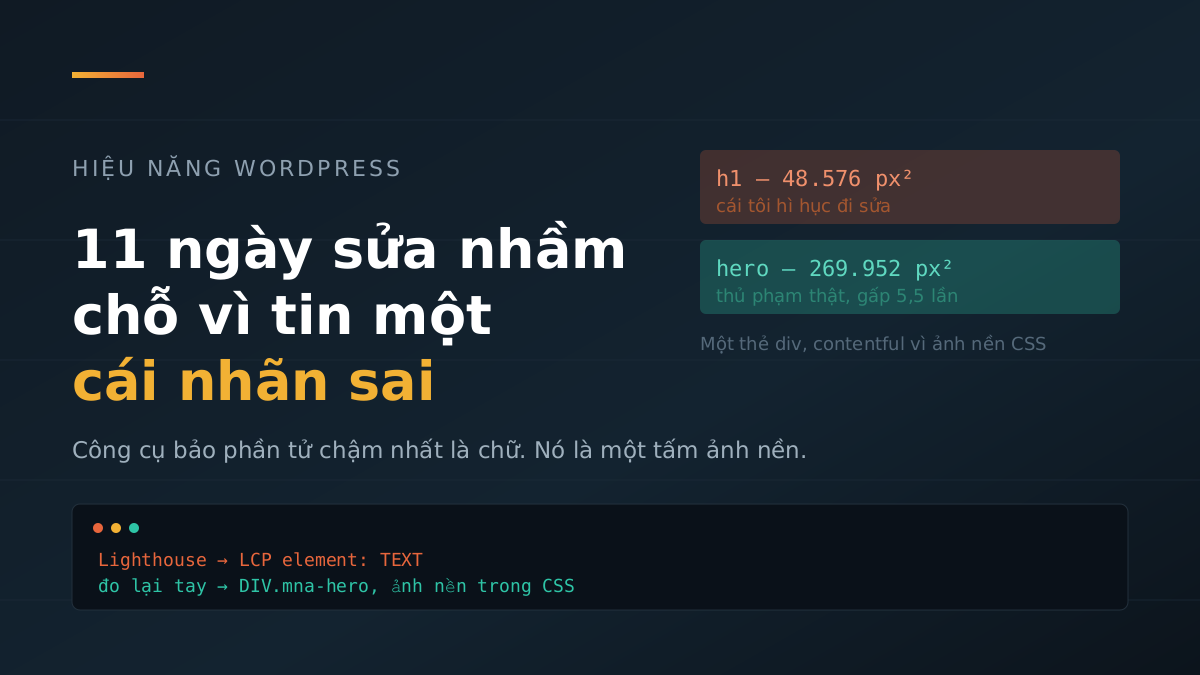
On 20/07/2026, I measured the homepage speed in mobile mode. The tool correctly identified the slowest element on the page, along with a label: TEXT. I read that label, concluded that the slowest element was text, and immediately crossed off everything related to images — image compression, format changes, early image loading. Images had nothing to do with it, or so the tool said.
Eleven days later, I measured it again by hand. That element was counted in LCP not because of the text, but because of a background image declared in CSS. The thing I ruled out from the start was exactly the most effective fix.
What the label said, and how I read it
LCP is the metric that measures how long it takes for the largest element in the initial viewport to appear. The measurement tool identified that element as <div class="mna-hero"> and labeled its element type as TEXT.
My reasoning at the time, written out, makes the gap obvious: if this element is text, then to make it appear sooner I need to speed up font loading and remove CSS that blocks rendering. The hero image sat right behind that element — but since the tool said the LCP was TEXT, optimizing the hero image would be wasted effort.
I even wrote that conclusion into my technical notes: “preload the hero image, remove lazy loading, switch to AVIF — useless for LCP”. That line stayed there for 11 days and shaped everything I did afterward.
What made me measure again
What did not add up was the 7.8-second LCP breakdown. It split into four parts, and the first three were all small:
- Waiting for the server to send the first byte: 624 ms
- Waiting for the browser to figure out what to load: 692 ms
- Loading that resource: 30 ms
- Waiting for it to be painted on screen: 6,496 ms
The last segment accounted for 83% of the total. If this element were truly text, then 6.5 seconds of “waiting to paint” should have been explainable by fonts or render-blocking CSS. I removed some real render-blocking CSS, and the number did not move. There was a 692-millisecond segment labeled “waiting to figure out what to load” — and a block of text does not need anything loaded.
I should have been suspicious much earlier. During those 11 days, I did exactly the things a slow text element would need: cutting down the theme CSS to lighten the rendering path, rebuilding the critical CSS. Each time I finished, I measured again and LCP stayed put. I concluded I had not cut deeply enough, then went back and cut more. Not once did I stop to ask whether the original label was correct.
So I abandoned the scoring tool and wrote a small script that runs directly in the browser to record the entire LCP candidate chain — not just the final one — along with each tag name and size.
The candidate chain told a very different story
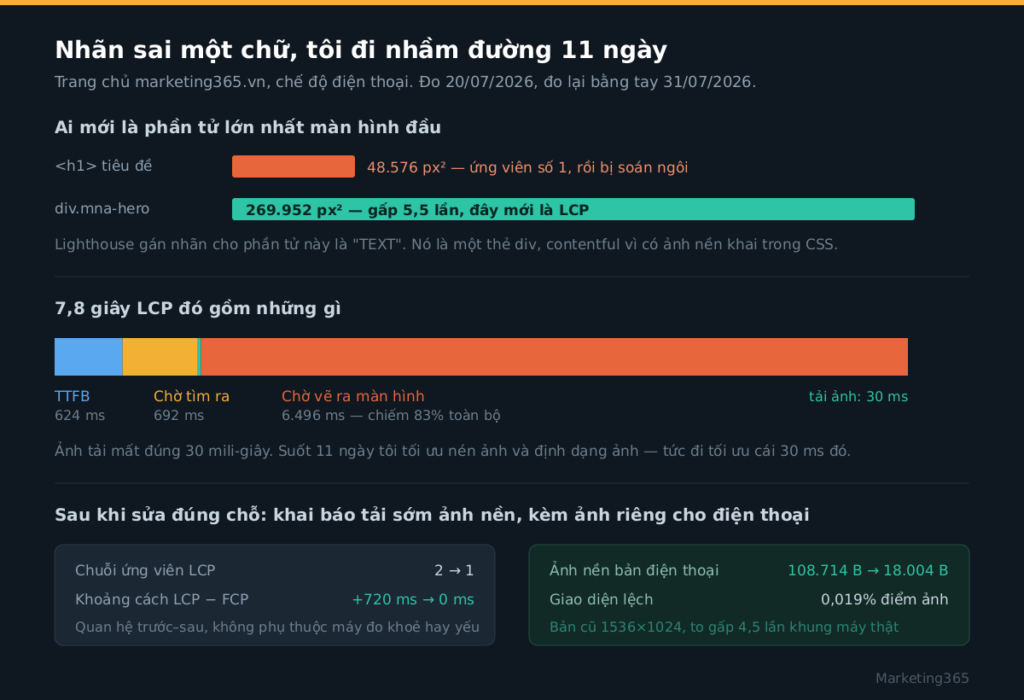
There were two candidates, not one:
- Candidate 1: the
<h1>tag, area 48,576 px² - Candidate 2, and the one that was counted:
div.mna-hero, area 269,952 px² — 5.5 times larger
The <h1> took the lead first, then the hero block overtook it. The tool only told me who won at the end, and the TEXT label it assigned to that winner was wrong.
Where it went wrong: div.mna-hero is a div tag, and it was counted as “having content” not because of the text inside it, but because of a background image declared in CSS with background: image-set(url(...)). For the browser, that is an image, and it qualifies as LCP. For the tool’s label, it was a div containing text.
Read more: AI Is Getting Your Store Location Wrong. Fix the Data, Not the Page.
And the 692-millisecond “waiting to figure out” segment was the trace left by that very image. When an image is declared in CSS, the browser cannot see it while scanning HTML. The required sequence is: read the HTML, download the CSS file, parse the CSS file, match the selector, and only then know which image needs to be loaded. Several back-and-forth steps happen before the image request is sent.
The fix: tell the browser in advance
The solution is to declare the background image for early loading directly in HTML, so the browser can send the request without waiting for CSS to finish loading. On the current homepage, there are exactly these two lines:
<link rel="preload" as="image" type="image/webp"
      href=".../assets/hero-bg-mobile.webp"
      media="(max-width: 768px)" fetchpriority="high">
<link rel="preload" as="image" type="image/webp"
      href=".../assets/hero-bg.webp"
      media="(min-width: 769px)" fetchpriority="high">
There were two details in there that I had to pay for before I learned them:
mediais mandatory. Without it, every device downloads both images, and the page gets slower than before the fix. An early-load declaration that loads the wrong thing early is worse than none at all.- The path must match the CSS path character for character. Add a
?ver=at the end, and the browser treats it as a different image and downloads it a second time.
While I was at it, I also cut a separate image for mobile. The version in use was 1536×1024, while the actual frame on mobile was only 721 pixels wide — about 4.5 times larger than needed. The new 800×533 version weighs 18,004 bytes instead of 108,714 bytes, an 83% reduction.
Verifying with something less noisy
This server runs many tasks at once, so the absolute millisecond values measured on it jump around from run to run. For that reason, I did not use “how many seconds LCP dropped” as proof, but two relationship-based measures:
- LCP candidate chain: 2 down to 1. The hero block now appears at the same time as the text, with no more case of text appearing first and the image jumping in afterward.
- LCP − FCP gap: from +720 ms to 0 ms. In other words, the largest element now appears at the exact moment the page paints its first pixel. Whether the machine is fast or slow, that number is still 0.
I also had to make sure I was not trading design for speed. I captured the page before and after and compared it pixel by pixel: a 0.019% pixel difference, with the largest deviation at 12 on a 255 scale — invisible to the naked eye. I also logged requests at both screen sizes to make sure mobile loaded only the mobile version, desktop loaded only the desktop version, and no device downloaded duplicates.
What I took away from this
The element-type label the measurement tool gives you is a guess, not a conclusion. With an <img> tag, it is certainly correct. With a <div> tag, you have to ask one more question: is this tag counted as content because of the text inside it, or because of a background image declared in CSS? Those two cases require two completely different fixes.
And do not look only at the final LCP element. Record the full candidate chain, along with sizes. If I had done that on day one, I would have seen that there were two candidates and that the larger one, 5.5 times bigger, was an image block — and 11 days would have been gone.
There was one more clue that, looking back, was obvious: the “waiting to figure out what to load” segment lasted 692 milliseconds. That segment only exists when there is a resource that has to be loaded. A pure text block would make that segment zero. The breakdown was plainly saying that this element needed an image loaded, right under a label that said text. I read the label and ignored the numbers.
Misreading a metric and going down the wrong path was not the only time it happened on this site. Once I misread it in the opposite direction: optimizing CSS made the speed score drop from 38 to 14 — the tool answered a slightly different question very accurately.