

Contents
Search Console reports that 646 pages on marketing365.vn are not in the index, while 322 pages are indexed. The first reflex for almost everyone is the same: the content must not be good enough, there must not be enough backlinks, we probably need to write longer articles. We thought so too, until we sat down to count the server logs.
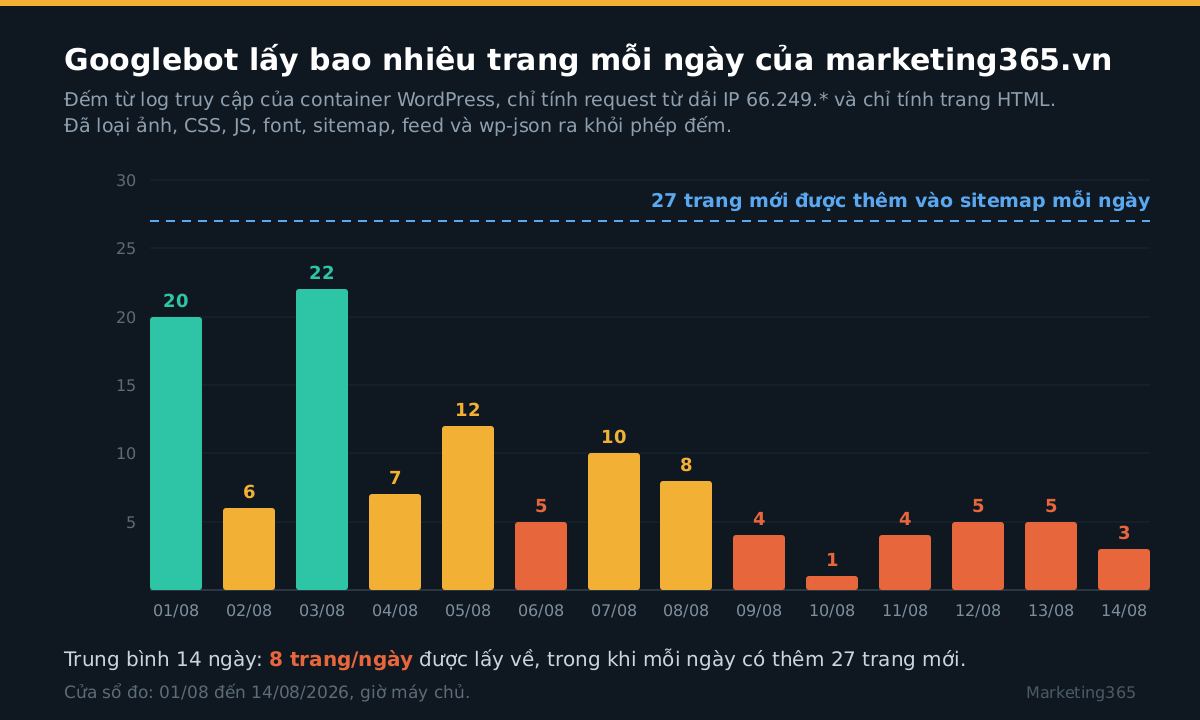
The number that emerged was something very different. In the first 14 days of August 2026, Googlebot fetched an average of 8 HTML pages per day. Over the same period, the site’s sitemap grew by 27 addresses per day. No article is good enough to close a gap of 19 pages a day.
Where to count to get the right number
Before trusting any number above, it is important to say exactly where it came from, because there is a trap here that cost us half a day.
The first place everyone thinks of is /var/log/nginx/access.log. On this server, it is useless: nginx is serving 13 different domains, all writing to the same file, and the default log format does not include a host field. That means from a log line you can tell who came in, when they came in, and which path they hit — but not which site they visited. Any count from that file is a combined total of 13 sites.
The correct place to count is the log for the WordPress container itself:
$ docker inspect --format='{{.LogPath}}' mna_wp
/var/lib/docker/containers/50ac37c8.../50ac37c8...-json.log
This container serves only one site, so every line in it belongs to marketing365.vn. Be sure to read the adjacent .log.1.gz, .log.2.gz files as well — Docker rotates and compresses logs, and if you only open the current file, you will only see today’s data. The first time, we missed exactly this point and ended up with a “measurement window: 1 day” result.
The second step is filtering for real Googlebot traffic. Anyone can fake the User-Agent field, and there are plenty of crawlers that claim to be Googlebot. The reliable way is to filter by Google’s published IP ranges, here 66.249.*. All the figures in this article count only requests from that range.
Four-fifths of the crawl budget never reaches articles
Counting the full retained log window — 09/06 to 14/08/2026, meaning 50 days with data, interrupted from 25/06–11/07 because of log rotation — Googlebot sent 3,851 requests. But “requests” and “pages read” are two different things.
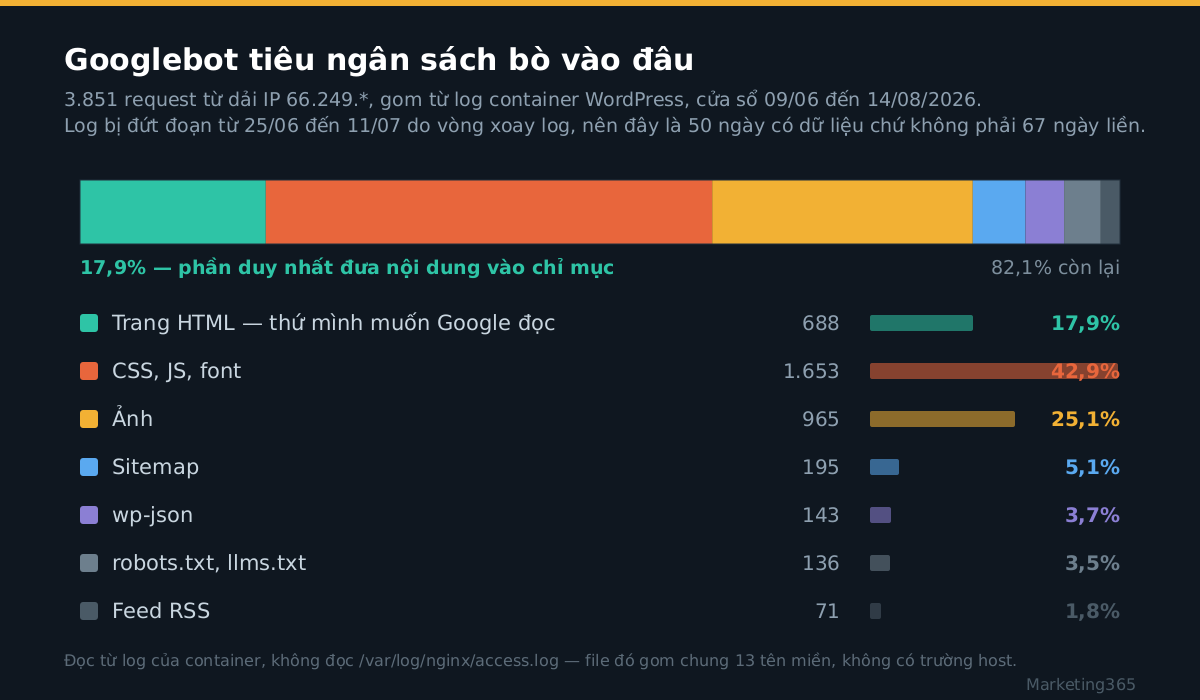
Only 688 requests, or 17.9%, were HTML pages. The rest: 1,653 requests for CSS, JS and fonts (42.9%), 965 requests for images (25.1%), 195 for sitemaps, 143 for wp-json, 136 for robots.txt and llms.txt, and 71 for RSS feeds.
This is not Google’s fault. Googlebot has to load CSS and JS to render the page it is reading — that is how it sees the page the way a user does. But it means every article you want indexed brings along a bundle of supporting requests, and that bundle draws from the same budget. The more scattered resources a site has, the thinner the share left for content.
Seen this way, cutting the theme CSS file from 1.2 MB to 243 KB has an additional benefit we did not think about when we did it: it is not only faster for visitors, it also reduces part of the cost every time Googlebot stops by.
Crawl speed is falling, not rising
Read more: Cache Is On, Yet the Site Is Still 1.3 Seconds Slow
The most frustrating part is the trend. The number of HTML pages fetched per day in the first half of August:
01/08  20     06/08   5     11/08   4
02/08   6     07/08  10     12/08   5
03/08  22     08/08   8     13/08   5
04/08   7     09/08   4     14/08   3
05/08  12     10/08   1
The first seven days averaged 11.7 pages/day. The next seven averaged 4.3. Meanwhile, publishing speed did not slow at all — the sitemap on 13/08 had 1,652 addresses, and on 14/08 it had 1,679.
Google does not disclose why crawl budget is allocated the way it is, so we will not guess. What can be stated with certainty is the arithmetic consequence: if Googlebot crawls 4 pages a day while 27 new pages are added daily, the pool of pages that have never been read grows by 23 pages every day, indefinitely, no matter how good the writing is.
This is also why the “Discovered – currently not indexed” status in Search Console keeps rising: 518 pages are in that state. Google knows these addresses exist, it is reading the sitemap regularly (195 sitemap requests are proof of that), it just has not scheduled them for fetching yet.
Waiting is not a strategy
At a pace of 4–8 pages a day, clearing more than a thousand pages that have never been read would take roughly 4 to 8 months, assuming no new posts were published during that time. But this site keeps publishing 27 pages a day. In other words: waiting for it to happen naturally is a plan that never reaches the finish line.
The three remaining approaches, in the order we are working on them:
- Push proactively through the Indexing API. This is the only approach that directly affects speed, instead of waiting for Google to schedule crawling on its own. The limit is 200 addresses per day, 25 times the current natural crawl rate. The implementation and real-world measurements are covered in a separate article.
- Reduce the budget consumed by supporting resources. Fewer CSS files, fewer fonts, more consolidated assets. Every request saved creates room for one more HTML page.
- Revisit publishing speed. Publishing 27 pages a day on a site where Google can only read 8 pages means the excess does not disappear; it queues up. If the queue is already longer than 1,000 pages, adding more posts does not help today.
How to check this on your own site
If your Search Console is also reporting a pile of “discovered but not indexed” pages, these three steps take half an hour and tell you which situation you are in:
One. Count the number of addresses in today’s sitemap and write it down. Count again tomorrow. The difference is your real publishing speed, which is often higher than you think because it includes category pages, pagination pages, and translations.
Two. Find the log file written specifically for that site — not the combined server log — then count the lines with IPs starting with 66.249. and paths that are not images, CSS, JS, sitemaps, or feeds. Divide by the number of days.
Three. Compare the two numbers. If crawl speed is higher than publishing speed, your problem is page quality, not crawl budget — that is when you go back to content. If the opposite is true, as in this case, writing more articles will not solve anything. The background on how to read Search Console reports is covered in the article how to use Google Search Console for beginners.
The figures in this article come from one specific site, at one specific time, measured in one specific way. Your site will almost certainly produce different numbers. What is worth taking away is the comparison: inflow versus outflow, measured from your own logs.