
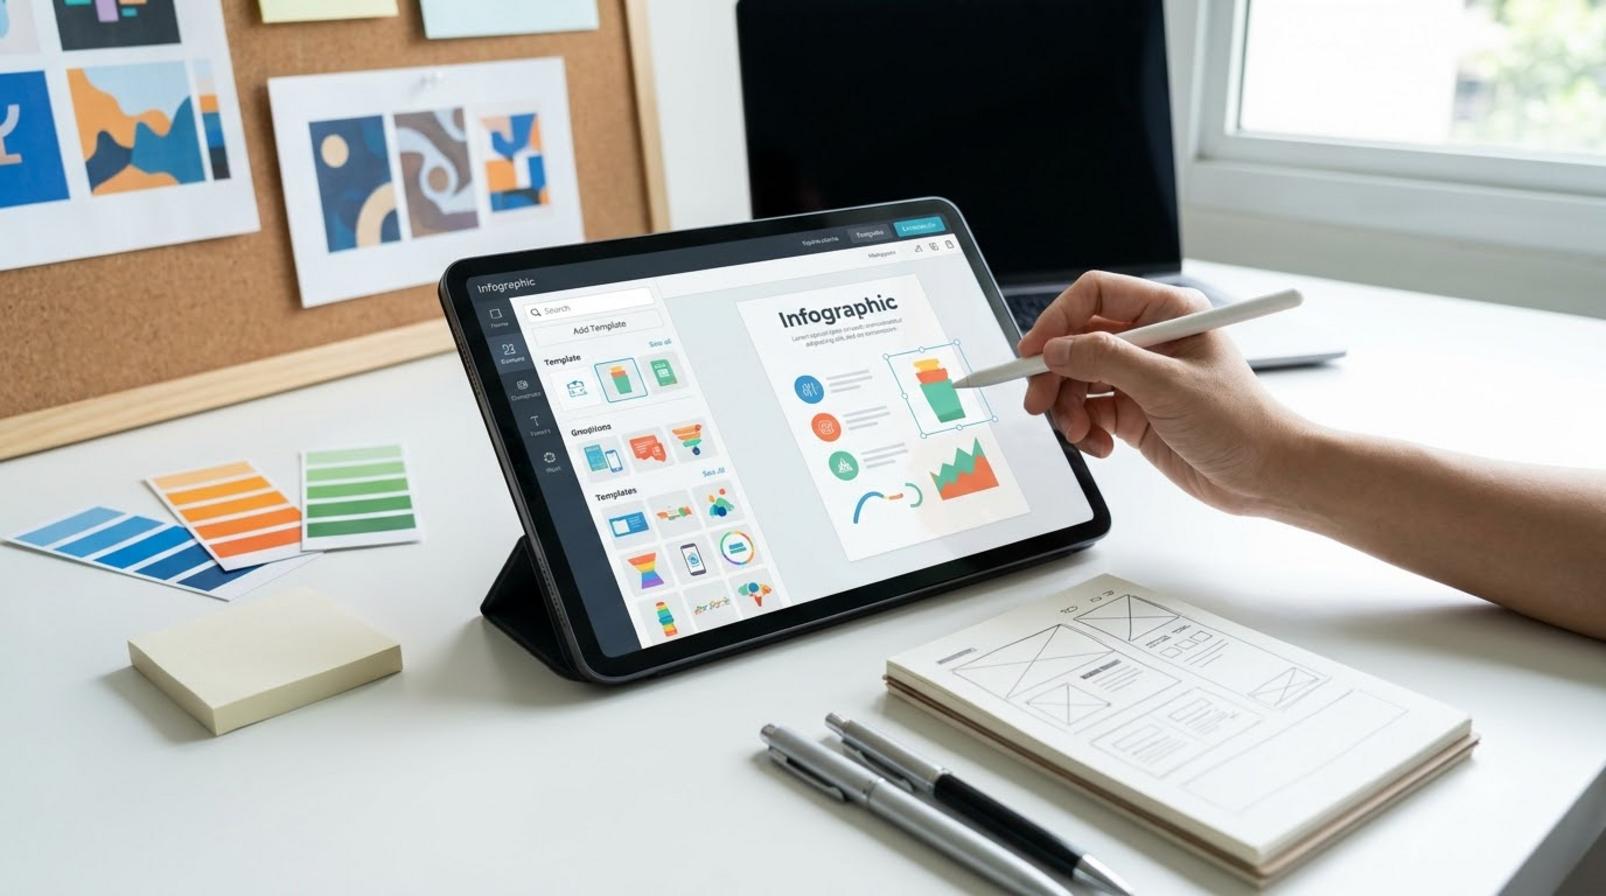
Free Infographic Maker Tools: How to Choose

Free Infographic Maker Tools: How to Choose

Written by Nguyễn Nhật Ánh Dương, reviewed under the Content Policy of Marketing365. Last updated .

Contents
  1. You need to understand what type of “free infographic maker tool” is being discussed
    1. How are online software, mobile apps, and AI tools different?
    2. When should you prioritize free tools, and when should you avoid forcing the free version?
  2. Criteria for choosing the right free tool for your infographic goals
    1. 7-point checklist before choosing a tool
    2. Signs the tool is suitable for marketers, shop owners, or small teams
  3. Which tool should you choose for each specific use case?
    1. If you need to work fast in a few minutes, which type should you choose?
    2. If you need something more polished and brand-consistent, what should you prioritize?
    3. If you want to try AI for idea generation, how should you use it?
  4. How to create a beautiful infographic with free tools without design skills
    1. Step 1: Choose the goal and infographic type before opening a template
    2. Step 2: Reduce the content to one main message and 3–5 supporting points
    3. Step 3: Adjust the layout, colors, and icons so it’s easy to read on mobile
    4. Step 4: Review before publishing or downloading
  5. Common mistakes when using free infographic maker tools
    1. Packing too much text and too many numbers into one frame
    2. Choosing colors, fonts, and icons that don’t match
    3. Trusting AI or templates completely without checking them
  6. Which tool should you use for each real marketing scenario?
    1. Creating infographics for social media and sales content
    2. Creating infographics for short reports, slides, or internal documents
  7. Frequently asked questions about free infographic maker tools
  8. Criteria for choosing the right free tool for your infographic goals
    1. 7-point checklist before choosing a tool
    2. Signs the tool is suitable for marketers, shop owners, or small teams
  9. Which tool should you choose for each specific use case?
    1. If you need to work fast in a few minutes, which type should you choose?
    2. If you need something more polished and brand-consistent, what should you prioritize?
    3. If you want to try AI for idea generation, how should you use it?
  10. How to create a beautiful infographic with free tools without design skills
    1. Step 1: Choose the goal and infographic type before opening a template
    2. Step 2: Reduce the content to one main message and 3–5 supporting points
    3. Step 3: Adjust the layout, colors, and icons so it’s easy to read on mobile
    4. Step 4: Review before publishing or downloading
  11. Common mistakes when using free infographic maker tools
    1. Packing too much text and too many numbers into one frame
    2. Choosing colors, fonts, and icons that don’t match
    3. Trusting AI or templates completely without checking them
  12. Which tool should you use for each real marketing scenario?
    1. Creating infographics for social media and sales content
    2. Creating infographics for short reports, slides, or internal documents
  13. Frequently asked questions about free infographic maker tools

When you need to create an infographic quickly for marketing, sales, or social content, the challenge is usually finding a free tool that is still easy to use and doesn’t look amateurish. With free infographic maker tools, the key is choosing the right option for the situation: simple drag-and-drop, ready-made templates, or AI-assisted layout creation.

This introduction helps you define the selection criteria, identify which type of tool to prioritize for each task, and avoid mistakes that make infographics look cluttered, lack emphasis, or become hard to read on mobile.

You need to understand what type of “free infographic maker tool” is being discussed

Free infographic maker tools are a group of tools that let you build infographics without paying for software, but each type suits a different task. If you understand this from the start, you’ll choose faster between web apps, mobile apps, ready-made templates, or AI tools.

People creating social posts often need to work quickly on a computer or phone. Those making mini reports need a clean layout and easy file export. Small shops often prioritize ready-made templates so they can swap in content and publish product posts right away.

How are online software, mobile apps, and AI tools different?

Free online infographic software runs in the browser, so it’s a good fit when you work on a computer and don’t want to install anything. Mobile apps are convenient for basic edits, especially when you need to create a free infographic for social media while on the move. Free AI infographic tools are strongest at suggesting layouts and generating quick drafts; meanwhile, free online infographic templates are ideal when you want something polished fast without building from scratch.

  • Web app: easy to use, ready as soon as you open it, suitable for landing pages or short reports.
  • Mobile app: good for quickly editing captions, changing colors, and cropping images before posting.
  • AI tool: useful when you need a quick draft for a still-rough idea.
  • Template tool: useful when you only need to change text and images while keeping the existing layout.

When should you prioritize free tools, and when should you avoid forcing the free version?

Free infographic maker tools are enough when you create infrequently, need to test ideas, or only export a few simple files. But if the free version has a watermark, template limits, export limits, or is hard to adapt to your brand identity, you’ll spend more time than you save.

You need to understand what type of “free infographic maker tool” is being discussed

Criteria for choosing the right free tool for your infographic goals

The criteria for choosing a free infographic maker tool are ease of use, export quality, and how well it fits your purpose. Choosing correctly from the start helps you avoid wasting time switching platforms just because a template looks good but won’t let you edit colors, Vietnamese fonts, or exports come out blurry.

7-point checklist before choosing a tool

A good free infographic maker tool must pass these 7 quick checks: it has templates for the right topic, drag-and-drop is easy to use, PNG/PDF exports are sharp, charts/icons are supported, colors can be changed to match your brand, templates can be saved or duplicated quickly, and it runs smoothly on web or mobile. For free online infographic software, this is a fast way to filter options before signing up.

  • Has a free online infographic template library for the topic you need.
  • The drag-and-drop interface is simple enough for beginners to use in minutes.
  • Lets you export PNG or PDF without broken text or distorted icons.
  • Includes charts, icons, or data blocks to build infographics quickly.
  • Lets you change colors, logos, and fonts to match your brand identity.
  • Allows saving, duplicating, or copying templates for reuse across multiple campaigns.
  • Runs stably on web or mobile without errors when multiple layers are open.

If you need a tool for people who don’t know design, ease of use should be your top priority. If you want to create infographics with Canva for free or create infographics with Piktochart for free, check Vietnamese font support and export quality before deciding.

Signs the tool is suitable for marketers, shop owners, or small teams

Free infographic maker tools are most suitable when they help you produce new versions quickly while keeping content and visuals consistent. For marketers, a good sign is the ability to create multiple versions of the same layout to test headlines, colors, and CTAs.

Criteria for choosing the right free tool for your infographic goals

Shop owners often need a simple infographic website to combine product images, prices, and promotions in just a few minutes. Small teams should prioritize free AI infographic tools or tools with ready-made templates, since there isn’t always a designer available to make manual edits.

If a tool makes you go through too many steps before producing a usable version, it’s not a good fit for fast, repeatable work.

Which tool should you choose for each specific use case?

Free infographic maker tools should be chosen based on your use case, because each type is strong in a different area: speed, brand consistency, or AI-assisted idea sketching. Choosing correctly from the start saves time and avoids repeated layout revisions.

If you need to work fast in a few minutes, which type should you choose?

You should choose free online infographic templates with a simple layout. This group is suitable for social posts, internal announcements, or short mini reports.

Quick selection method:

  • Prioritize templates with few columns and few layers.
  • Choose the “infographic,” “poster,” or “social graphic” category.
  • Only change the headline, data, and background color, then export.

For example, a post with 3 statistics for Facebook usually only needs one vertical template, one headline block, and 3 data boxes. If it takes more than 15 minutes to edit, switch to a simpler template.

Which tool should you choose for each specific use case?

If you need something more polished and brand-consistent, what should you prioritize?

You should choose an online infographic design tool that lets you flexibly adjust colors, fonts, and logos. This type is a good fit for in-house marketing teams because it makes it easy to keep the same identity across infographics, banners, and slides.

Criteria to look for:

  • Quick brand color changes.
  • Easy insertion of icons, charts, and illustrations.
  • Drag-and-drop content blocks without breaking the layout.

For example, if your brand uses 2 main colors and 1 fixed font, the tool should let you save a preset or adjust the theme in just 1–2 steps. Without presets, you’ll waste time repeating the same setup every time you create a new piece.

If you want to try AI for idea generation, how should you use it?

You should use AI for drafting, not for finalizing content. AI can suggest layouts, break down ideas, or draft headlines, but the data and message still need human review.

Safe workflow in 3 steps:

  • Enter the topic and goal into the AI.
  • Take the draft layout or short copy.
  • Review the data, order of ideas, and brand voice.

For example, when creating an infographic about monthly sales, AI can suggest 4 content blocks. But you still need to verify the original numbers in the report file or Google Sheets before publishing. This saves time while reducing the risk of inaccurate information.

How to create a beautiful infographic with free tools without design skills

You can create a beautiful infographic with free tools if you follow the right order: choose the goal, trim the content, adjust the layout, then export. Doing it in reverse often leads to a nice-looking template with a messy layout, too much text, and poor readability on mobile.

Step 1: Choose the goal and infographic type before opening a template

Choosing the right infographic type helps you avoid having to redo the layout later. If the content explains a concept, choose a vertical flow; if it’s a process, choose a step-by-step layout; if it compares things, choose a split-column template; and for data infographics, prioritize large information blocks with little text.

Before opening a free online infographic template, ask yourself: does the audience need to understand quickly or compare things? The answer determines the structure, not the colors or icons. For a tool for people who don’t know design, choosing the wrong template type is the most common mistake because you then have to cut text, change blocks, and rebuild almost from scratch.

Step 2: Reduce the content to one main message and 3–5 supporting points

An infographic should have only one main message and a few supporting points that can be scanned in seconds. If you try to cram in an entire paragraph, viewers will miss the most important part.

The cleanest method is to write out all the ideas, then cross out the long explanations and keep only short phrases. Each content block should have one job: headline, data, example, or conclusion. When creating infographics with Canva for free or on any simple infographic website, prioritize short phrases under 10 words for each content chunk. If you have 7 points, cut them down to the 3–5 strongest.

How to create a beautiful infographic with free tools without design skills

Step 3: Adjust the layout, colors, and icons so it’s easy to read on mobile

A good layout is one that can be read immediately on a small screen. Free infographics for social media often fail because the text is too small, the colors are too many, or the icons are inconsistent. That’s why free online infographic software should only be used as a framework, while readability should be the final criterion.

Keep strong contrast between text and background, especially on light backgrounds. One main color and one accent color are enough; more than that will make charts look cluttered. Icons should share the same style, for example all line icons or all flat icons, not mixed together. White space also matters: leave enough margin so the content doesn’t feel cramped. When checking on a phone, if you have to zoom in to read it, reduce the text right away.

Step 4: Review before publishing or downloading

A final check helps you avoid small mistakes that make an infographic look unprofessional. With no-cost infographic creation, this step is often skipped because people assume a nice template is enough.

Quick checklist before downloading:

  • Check spelling in every headline and data point.
  • Align the spacing evenly between blocks.
  • Check font size on a small screen.
  • See whether any elements are cut off at the edges.
  • Reduce overly harsh colors if the background already has many details.

If the exported file looks fine on a computer but misaligned on a phone, go back to the layout step before posting. One proper review in the right order usually saves far more time than fixing it after sharing.

Common mistakes when using free infographic maker tools

Mistakes when using free infographic maker tools usually come from three places: too much content, inconsistent design, and skipping the final review. If you handle these in the right order, your infographic will be easier to read on mobile, require fewer revisions, and slow down a small team less.

Packing too much text and too many numbers into one frame

This is the mistake that kills an infographic’s effectiveness the fastest. When one frame contains too many sentences, viewers can’t scan the information in time, the key point gets buried, and the whole layout starts to look like a report document.

Common mistakes when using free infographic maker tools

The signs are easy to spot: every box is packed with text, headlines are short but descriptions run long, and numbers are scattered everywhere so the eye doesn’t know where to start. For a tool for people who don’t know design, the safe approach is to keep only 1 main idea per frame, 1 key number, and 1 short explanation. If you need more data, split it into 2–3 smaller blocks instead of cramming everything into one image.

Quick checklist:

  • Keep only 1 message per frame.
  • Cut descriptions down to 1–2 lines.
  • Prioritize the most important data.
  • Check on a phone screen before exporting.

Choosing colors, fonts, and icons that don’t match

A design with ready-made templates can still look messy if the colors, fonts, and icons don’t belong to the same system. This mistake usually shows up when someone uses too many different fonts, overly harsh contrast colors, or mixes thin-line icons with 3D icons in the same frame.

In online infographic design, the easy-to-spot signs are a strong headline but weak body text, icons that vary from section to section, and background colors that make text hard to read. The way to avoid this is to use only 1–2 fonts, choose one primary color and one accent color, and keep the same icon style from start to finish. If the template already looks good, even a few mismatched details can make the whole layout feel unprofessional.

Trusting AI or templates completely without checking them

Creating infographics with AI saves time, but it doesn’t eliminate the need for review. AI or templates may arrange content in the wrong order, choose a layout that doesn’t fit the data, or generate generic copy that makes the information feel diluted.

The safe approach is to review in 3 layers: is the order of ideas correct, do the numbers match the source, and is the wording specific enough? For free online infographic software, you should also check the exported file because text can get cut off, icons can shift, or colors can change slightly when converting to PDF. Just 5 minutes of proofreading before publishing can save you from having to redo everything.

Which tool should you use for each real marketing scenario?

Choosing the right tool for each marketing scenario helps you produce content quickly, keep the layout clear, and avoid wasting time on revisions. With free infographic maker tools, prioritize those with ready-made templates, quick mobile editing, and clear exports that look good on both phones and large screens.

Which tool should you use for each real marketing scenario?

Creating infographics for social media and sales content

Free infographic maker tools are best suited for social media when they offer vertical templates, little text, and a CTA placed at the bottom. A Facebook or Instagram post is usually read in just a few seconds, so the layout needs to be compact with one main idea per frame.

Quick selection checklist:

  • Keep one main message per slide or frame.
  • Use short headlines, such as “5 tips to increase orders,” instead of a long sentence.
  • Choose templates with a large image area and few decorative details.
  • Prioritize tools that let you change colors, fonts, and images in 1–2 steps.

For small teams, Canva Free is often a good fit for quick sales posts because it has many social templates and easy drag-and-drop controls. If you need to test multiple ad versions, choose a template that’s easy to duplicate so you can A/B test headlines or CTAs without rebuilding from scratch.

Creating infographics for short reports, slides, or internal documents

Free infographic maker tools for internal reports should be strong in charts, data blocks, and logical reading flow. The goal here is for viewers to immediately understand which numbers are up, which are down, and where the conclusion is.

Quick selection method:

  • Choose software with clear bar charts, pie charts, or timelines.
  • Open it first in print view or insert it into PowerPoint to see whether the text is too small.
  • Prioritize one-column or two-column layouts to avoid clutter during presentations.
  • If your team needs to update numbers often, choose a tool that lets you update text and charts quickly.

Piktochart and Canva Free are often suitable when you need to export short reports for marketing, sales, or operations teams. For example, a simple dashboard can include 3 key numbers: reach, CTR, and orders, plus a conclusion box at the end so viewers can make a quick decision.

Frequently asked questions about free infographic maker tools

Free infographic maker tools are enough for basic needs such as creating posts, slides, short reports, or social media content. If you need quick exports, ready-made template editing, and no complex design requirements, this type of tool works well.

  • For everyday marketing needs, prioritize tools with free online infographic templates, a clear icon library, and stable PNG/PDF exports.
  • If you need to edit many details, check the free-version limits: number of templates, watermark, resolution, and team-sharing capabilities.

Whether you should choose AI or templates depends on the task. AI is useful when you need a quick framework, while templates are better when you need layout control and consistent branding. A small team often uses templates to produce regular posts, then tries free AI infographic tools for ideas that need speed.

You don’t need design skills to do it, but you should still understand 3 things: keep one color palette, use no more than 2 fonts, and don’t pack too much text into one frame. When opening a simple infographic website, try editing one template first; if it takes more than 10 minutes to find the text or color controls, the tool isn’t suitable for beginners.

It’s fine for marketing as long as the content is clear and the exported file isn’t overly compressed. For free social media infographics, check the aspect ratio, readability on a phone screen, and the ability to add a logo. If the content needs to be quickly aligned across multiple campaigns, a tool for people who don’t know design will save more time than drawing from scratch.

Frequently asked questions about free infographic maker tools

MARKETING365
📧 Email: lienhe@marketing365.vn
🌐 Website: https://marketing365.vn
👍 Fanpage: https://facebook.com/marketing365.official

For official and up-to-date guidance, you can also refer to resources from Think with Google.

You can also read more articles on the same topic in the Martech Tools category.

  • Use free tools for one-off posts, demos, or test content.
  • Don’t force the free version when producing at scale, running important campaigns, or needing brand consistency.
  • If you have to keep editing to remove a watermark or change the layout, that’s a sign you should switch to another solution.
  • For shops and small teams, a no-cost way to create attractive infographics is only suitable at the beginning; as volume grows, free versions usually slow you down.


Criteria for choosing the right free tool for your infographic goals

The criteria for choosing a free infographic maker tool are ease of use, export quality, and how well it fits your purpose. Choosing correctly from the start helps you avoid wasting time switching platforms just because a template looks good but won’t let you edit colors, Vietnamese fonts, or exports come out blurry.

7-point checklist before choosing a tool

A good free infographic maker tool must pass these 7 quick checks: it has templates for the right topic, drag-and-drop is easy to use, PNG/PDF exports are sharp, charts/icons are supported, colors can be changed to match your brand, templates can be saved or duplicated quickly, and it runs smoothly on web or mobile. For free online infographic software, this is a fast way to filter options before signing up.

  • Has a free online infographic template library for the topic you need.
  • The drag-and-drop interface is simple enough for beginners to use in minutes.
  • Lets you export PNG or PDF without broken text or distorted icons.
  • Includes charts, icons, or data blocks to build infographics quickly.
  • Lets you change colors, logos, and fonts to match your brand identity.
  • Allows saving, duplicating, or copying templates for reuse across multiple campaigns.
  • Runs stably on web or mobile without errors when multiple layers are open.

If you need a tool for people who don’t know design, ease of use should be your top priority. If you want to create infographics with Canva for free or create infographics with Piktochart for free, check Vietnamese font support and export quality before deciding.

Signs the tool is suitable for marketers, shop owners, or small teams

Free infographic maker tools are most suitable when they help you produce new versions quickly while keeping content and visuals consistent. For marketers, a good sign is the ability to create multiple versions of the same layout to test headlines, colors, and CTAs.

Criteria for choosing the right free tool for your infographic goals

Shop owners often need a simple infographic website to combine product images, prices, and promotions in just a few minutes. Small teams should prioritize free AI infographic tools or tools with ready-made templates, since there isn’t always a designer available to make manual edits.

If a tool makes you go through too many steps before producing a usable version, it’s not a good fit for fast, repeatable work.

Which tool should you choose for each specific use case?

Free infographic maker tools should be chosen based on your use case, because each type is strong in a different area: speed, brand consistency, or AI-assisted idea sketching. Choosing correctly from the start saves time and avoids repeated layout revisions.

If you need to work fast in a few minutes, which type should you choose?

You should choose free online infographic templates with a simple layout. This group is suitable for social posts, internal announcements, or short mini reports.

Quick selection method:

  • Prioritize templates with few columns and few layers.
  • Choose the “infographic,” “poster,” or “social graphic” category.
  • Only change the headline, data, and background color, then export.

For example, a post with 3 statistics for Facebook usually only needs one vertical template, one headline block, and 3 data boxes. If it takes more than 15 minutes to edit, switch to a simpler template.

Which tool should you choose for each specific use case?

If you need something more polished and brand-consistent, what should you prioritize?

You should choose an online infographic design tool that lets you flexibly adjust colors, fonts, and logos. This type is a good fit for in-house marketing teams because it makes it easy to keep the same identity across infographics, banners, and slides.

Criteria to look for:

  • Quick brand color changes.
  • Easy insertion of icons, charts, and illustrations.
  • Drag-and-drop content blocks without breaking the layout.

For example, if your brand uses 2 main colors and 1 fixed font, the tool should let you save a preset or adjust the theme in just 1–2 steps. Without presets, you’ll waste time repeating the same setup every time you create a new piece.

If you want to try AI for idea generation, how should you use it?

You should use AI for drafting, not for finalizing content. AI can suggest layouts, break down ideas, or draft headlines, but the data and message still need human review.

Safe workflow in 3 steps:

  • Enter the topic and goal into the AI.
  • Take the draft layout or short copy.
  • Review the data, order of ideas, and brand voice.

For example, when creating an infographic about monthly sales, AI can suggest 4 content blocks. But you still need to verify the original numbers in the report file or Google Sheets before publishing. This saves time while reducing the risk of inaccurate information.

How to create a beautiful infographic with free tools without design skills

You can create a beautiful infographic with free tools if you follow the right order: choose the goal, trim the content, adjust the layout, then export. Doing it in reverse often leads to a nice-looking template with a messy layout, too much text, and poor readability on mobile.

Step 1: Choose the goal and infographic type before opening a template

Choosing the right infographic type helps you avoid having to redo the layout later. If the content explains a concept, choose a vertical flow; if it’s a process, choose a step-by-step layout; if it compares things, choose a split-column template; and for data infographics, prioritize large information blocks with little text.

Before opening a free online infographic template, ask yourself: does the audience need to understand quickly or compare things? The answer determines the structure, not the colors or icons. For a tool for people who don’t know design, choosing the wrong template type is the most common mistake because you then have to cut text, change blocks, and rebuild almost from scratch.

Step 2: Reduce the content to one main message and 3–5 supporting points

An infographic should have only one main message and a few supporting points that can be scanned in seconds. If you try to cram in an entire paragraph, viewers will miss the most important part.

The cleanest method is to write out all the ideas, then cross out the long explanations and keep only short phrases. Each content block should have one job: headline, data, example, or conclusion. When creating infographics with Canva for free or on any simple infographic website, prioritize short phrases under 10 words for each content chunk. If you have 7 points, cut them down to the 3–5 strongest.

How to create a beautiful infographic with free tools without design skills

Step 3: Adjust the layout, colors, and icons so it’s easy to read on mobile

A good layout is one that can be read immediately on a small screen. Free infographics for social media often fail because the text is too small, the colors are too many, or the icons are inconsistent. That’s why free online infographic software should only be used as a framework, while readability should be the final criterion.

Keep strong contrast between text and background, especially on light backgrounds. One main color and one accent color are enough; more than that will make charts look cluttered. Icons should share the same style, for example all line icons or all flat icons, not mixed together. White space also matters: leave enough margin so the content doesn’t feel cramped. When checking on a phone, if you have to zoom in to read it, reduce the text right away.

Step 4: Review before publishing or downloading

A final check helps you avoid small mistakes that make an infographic look unprofessional. With no-cost infographic creation, this step is often skipped because people assume a nice template is enough.

Quick checklist before downloading:

  • Check spelling in every headline and data point.
  • Align the spacing evenly between blocks.
  • Check font size on a small screen.
  • See whether any elements are cut off at the edges.
  • Reduce overly harsh colors if the background already has many details.

If the exported file looks fine on a computer but misaligned on a phone, go back to the layout step before posting. One proper review in the right order usually saves far more time than fixing it after sharing.

Common mistakes when using free infographic maker tools

Mistakes when using free infographic maker tools usually come from three places: too much content, inconsistent design, and skipping the final review. If you handle these in the right order, your infographic will be easier to read on mobile, require fewer revisions, and slow down a small team less.

Packing too much text and too many numbers into one frame

This is the mistake that kills an infographic’s effectiveness the fastest. When one frame contains too many sentences, viewers can’t scan the information in time, the key point gets buried, and the whole layout starts to look like a report document.

Common mistakes when using free infographic maker tools

The signs are easy to spot: every box is packed with text, headlines are short but descriptions run long, and numbers are scattered everywhere so the eye doesn’t know where to start. For a tool for people who don’t know design, the safe approach is to keep only 1 main idea per frame, 1 key number, and 1 short explanation. If you need more data, split it into 2–3 smaller blocks instead of cramming everything into one image.

Quick checklist:

  • Keep only 1 message per frame.
  • Cut descriptions down to 1–2 lines.
  • Prioritize the most important data.
  • Check on a phone screen before exporting.

Choosing colors, fonts, and icons that don’t match

A design with ready-made templates can still look messy if the colors, fonts, and icons don’t belong to the same system. This mistake usually shows up when someone uses too many different fonts, overly harsh contrast colors, or mixes thin-line icons with 3D icons in the same frame.

In online infographic design, the easy-to-spot signs are a strong headline but weak body text, icons that vary from section to section, and background colors that make text hard to read. The way to avoid this is to use only 1–2 fonts, choose one primary color and one accent color, and keep the same icon style from start to finish. If the template already looks good, even a few mismatched details can make the whole layout feel unprofessional.

Trusting AI or templates completely without checking them

Creating infographics with AI saves time, but it doesn’t eliminate the need for review. AI or templates may arrange content in the wrong order, choose a layout that doesn’t fit the data, or generate generic copy that makes the information feel diluted.

The safe approach is to review in 3 layers: is the order of ideas correct, do the numbers match the source, and is the wording specific enough? For free online infographic software, you should also check the exported file because text can get cut off, icons can shift, or colors can change slightly when converting to PDF. Just 5 minutes of proofreading before publishing can save you from having to redo everything.

Which tool should you use for each real marketing scenario?

Choosing the right tool for each marketing scenario helps you produce content quickly, keep the layout clear, and avoid wasting time on revisions. With free infographic maker tools, prioritize those with ready-made templates, quick mobile editing, and clear exports that look good on both phones and large screens.

Which tool should you use for each real marketing scenario?

Creating infographics for social media and sales content

Free infographic maker tools are best suited for social media when they offer vertical templates, little text, and a CTA placed at the bottom. A Facebook or Instagram post is usually read in just a few seconds, so the layout needs to be compact with one main idea per frame.

Quick selection checklist:

  • Keep one main message per slide or frame.
  • Use short headlines, such as “5 tips to increase orders,” instead of a long sentence.
  • Choose templates with a large image area and few decorative details.
  • Prioritize tools that let you change colors, fonts, and images in 1–2 steps.

For small teams, Canva Free is often a good fit for quick sales posts because it has many social templates and easy drag-and-drop controls. If you need to test multiple ad versions, choose a template that’s easy to duplicate so you can A/B test headlines or CTAs without rebuilding from scratch.

Creating infographics for short reports, slides, or internal documents

Free infographic maker tools for internal reports should be strong in charts, data blocks, and logical reading flow. The goal here is for viewers to immediately understand which numbers are up, which are down, and where the conclusion is.

Quick selection method:

  • Choose software with clear bar charts, pie charts, or timelines.
  • Open it first in print view or insert it into PowerPoint to see whether the text is too small.
  • Prioritize one-column or two-column layouts to avoid clutter during presentations.
  • If your team needs to update numbers often, choose a tool that lets you update text and charts quickly.

Piktochart and Canva Free are often suitable when you need to export short reports for marketing, sales, or operations teams. For example, a simple dashboard can include 3 key numbers: reach, CTR, and orders, plus a conclusion box at the end so viewers can make a quick decision.

Frequently asked questions about free infographic maker tools

Free infographic maker tools are enough for basic needs such as creating posts, slides, short reports, or social media content. If you need quick exports, ready-made template editing, and no complex design requirements, this type of tool works well.

  • For everyday marketing needs, prioritize tools with free online infographic templates, a clear icon library, and stable PNG/PDF exports.
  • If you need to edit many details, check the free-version limits: number of templates, watermark, resolution, and team-sharing capabilities.

Whether you should choose AI or templates depends on the task. AI is useful when you need a quick framework, while templates are better when you need layout control and consistent branding. A small team often uses templates to produce regular posts, then tries free AI infographic tools for ideas that need speed.

You don’t need design skills to do it, but you should still understand 3 things: keep one color palette, use no more than 2 fonts, and don’t pack too much text into one frame. When opening a simple infographic website, try editing one template first; if it takes more than 10 minutes to find the text or color controls, the tool isn’t suitable for beginners.

It’s fine for marketing as long as the content is clear and the exported file isn’t overly compressed. For free social media infographics, check the aspect ratio, readability on a phone screen, and the ability to add a logo. If the content needs to be quickly aligned across multiple campaigns, a tool for people who don’t know design will save more time than drawing from scratch.

Frequently asked questions about free infographic maker tools

MARKETING365
📧 Email: lienhe@marketing365.vn
🌐 Website: https://marketing365.vn
👍 Fanpage: https://facebook.com/marketing365.official

For official and up-to-date guidance, you can also refer to resources from Think with Google.

You can also read more articles on the same topic in the Martech Tools category.

You may also like

Leave a Comment